一方
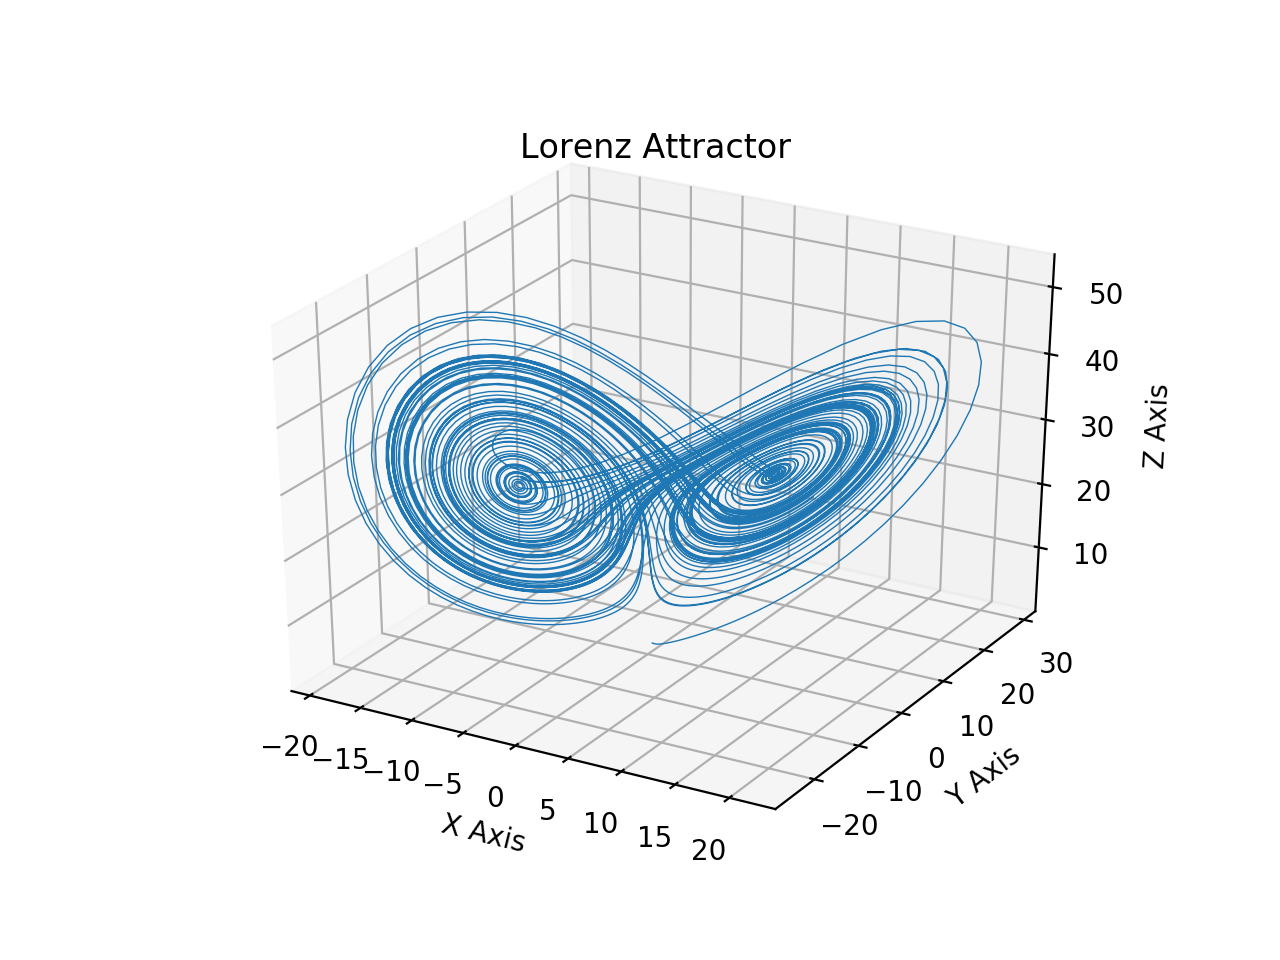
import numpy as np
import matplotlib.pyplot as plt
from scipy.integrate import odeint
from mpl_toolkits.mplot3d import Axes3D
rho = 28.0
sigma = 10.0
beta = 8.0 / 3.0
def f(state, t):
x, y, z = state # unpack the state vector
return sigma * (y - x), x * (rho - z) - y, x * y - beta * z # derivatives
state0 = [1.0, 1.0, 1.0]
t = np.arange(0.0, 40.0, 0.01)
states = odeint(f, state0, t)
fig = plt.figure()
ax = fig.gca(projection='3d')
ax.plot(states[:,0], states[:,1], states[:,2])
plt.show()